

ESXTOP is one of my favorite tool which comes in handy when i troubleshoot the ESXi performance issues. One of the difficulty in using ESXTOP is to connect to each ESXi host to access the performance of the ESXi server. So don’t worry VMware Flings brought a new Plugin called “ESXtopNGC Plugin”.ESXtopNGC Plugin is an enhanced, plugin-version of ESXtop for the vSphere Web Client. The plugin displays ESX server stats in new and more powerful ways by tapping into the GUI capabilities of the Web Client. It supports only on vCSA 5.5 (vCenter Center Server Linux Appliance) not on windows version of vCenter Server.
Features of ESXtopNGC Plugin:
- Separate tabs for CPU, memory, network and disk performance statistics
- Flexible batch output
- Flexible counter selection
- Advanced data grid for displaying stats (sortable columns, expandable rows, etc.)
- Configurable refresh rate
- VM-only stats
- Embedded tooltip for counter description
How to Install ESXtopNGC Plugin:
Installation of ESXtopNGC plugin is pretty simple. It can be done with 3 simple steps:
Step 1:
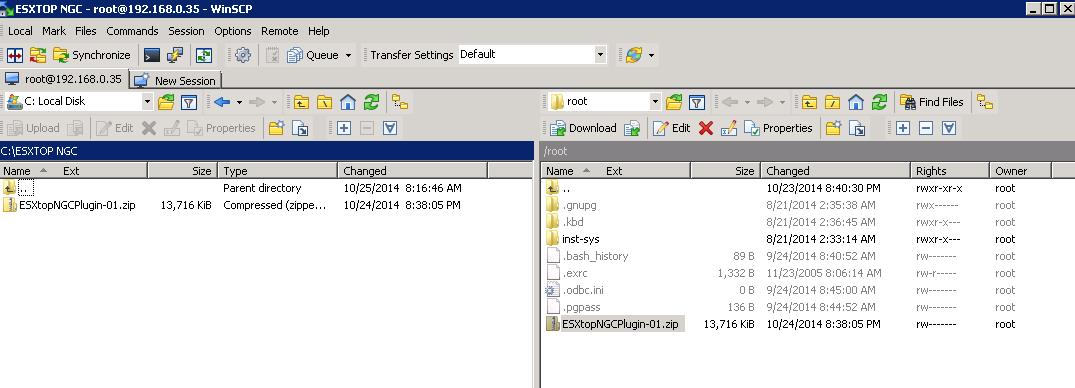
Upload ESXtopNGCPlugin.zip downloaded from VMware Flings website and upload it to the root of VCSA using Winscp.
Step 2:
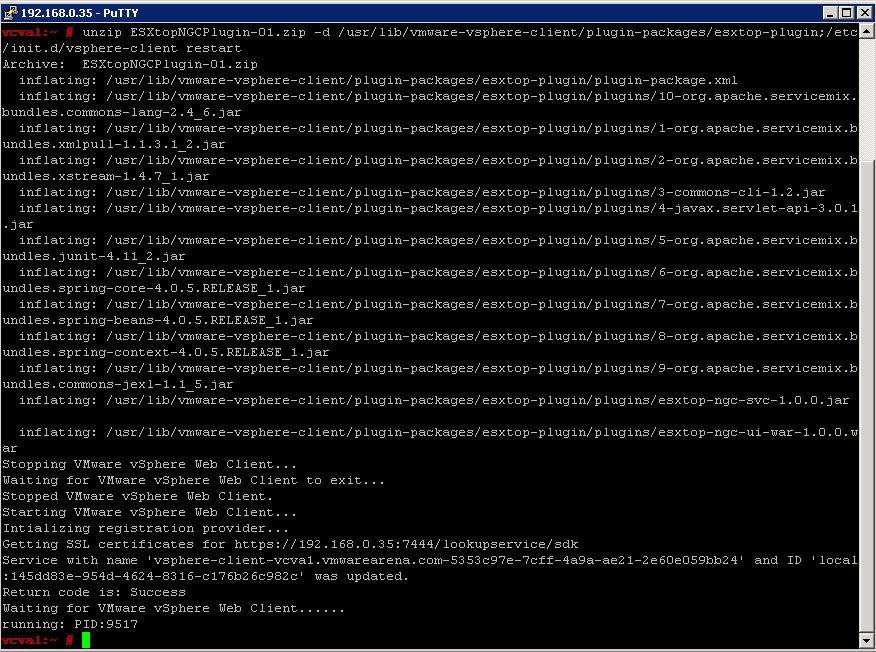
Connect to vCSA appliance using Putty. and execute the below command :
Unzip ESXtopNGCPlugin.zip -d /usr/lib/vmware-vsphere-client/plugin-packages/esxtop-plugin;/etc/init.d/vsphere-client restart
Step 3:
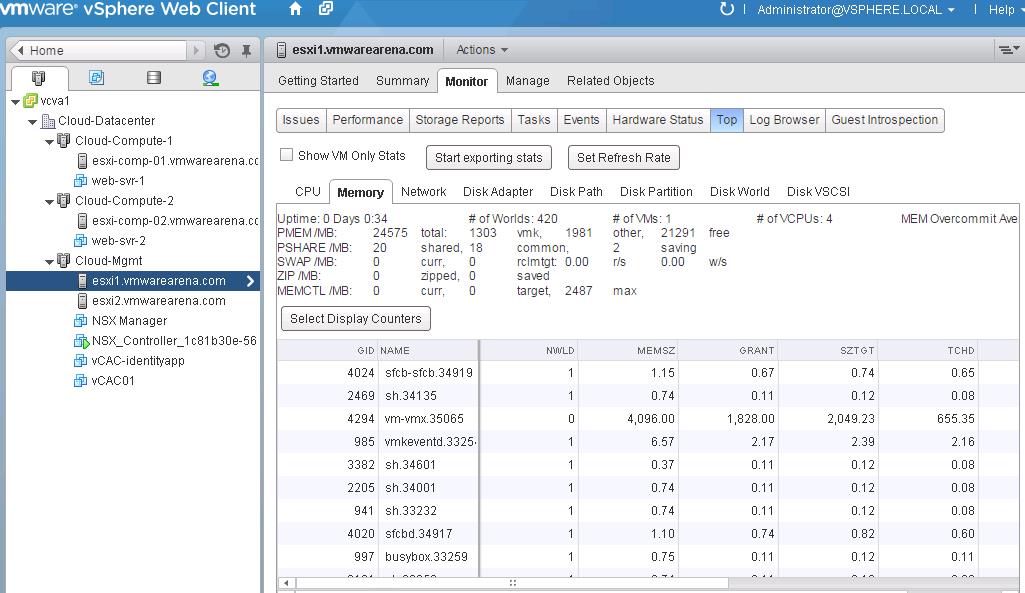
The above command restarts the vSphere web client automatically, so wait and when it’s completed you can access the vSphere Web Client, select a host and then Monitor tab >TOP. Data will appear after few seconds.
That’s it. We are Done. I hope this is informative for you. Thanks for reading!!!. Be Social and Share it in social media, if you feel worth sharing it.