

ESXTOP is a fantastic tool for VMware administrators which is inbuilt with ESXi hosts. ESXTOP helps VMware administrators to monitor and troubleshoot performance problems of ESXi host, storage, and virtual machine, etc. We have already talked a lot about esxtop on VMwareArena. I am sure most of the administrators will be aware of the various options available with esxtop to monitor CPU, memory, storage and network of ESXi host and virtual machines running on them in real-time. In vSAN 6.0 and later, vSAN specific counters were added to esxtop. In addition to the vSAN specific counters, esxtop already have the option to monitor VM activity, VMDK performance, adapter performance, IOPS and Latency observed at VM, VMDK and adapter. In this article, I will explain how to monitor vSAN performance using ESXTOP.
Take a look at article How to use the vSAN observer to monitor vSAN cluster performance
Monitor vSAN Performance using ESXTOP
To monitor the VSAN performance using esxtop, Login to ESXi host with root credentials using SSH and type esxtop.
You can press “h” to see the available options to monitor ESXi performance metrics. We have the below options :
c -> CPU , m -> Memory , n -> Network, d-> disk adapter , u -> Disk device ,v -> Disk vm , p -> Power management , i -> interrrupt and finally x -> VSAN
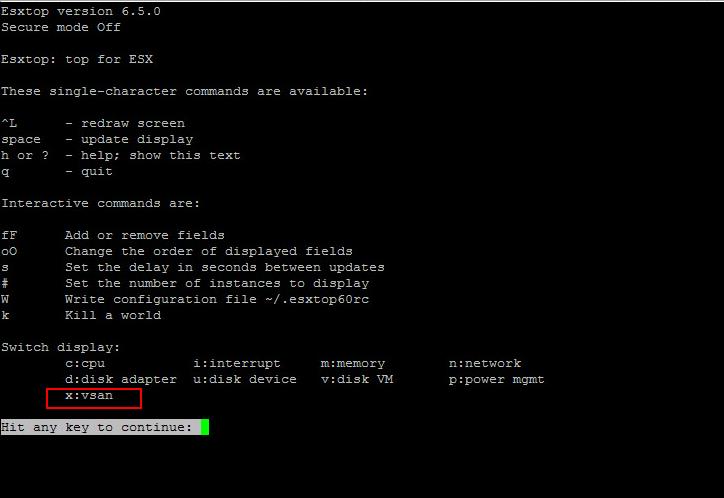
When you press “x” in esxtop, it will switch to the VSAN view in esxtop. It will display the metrics if VSAN is enabled on the cluster on which this ESXi host is part of.
If vSAN enabled -> it shows VSAN Enabled? Y
The vSAN view displays three different roles of DOM such as DOM client, DOM owner, and DOM component manager.
The distributed object manager (DOM) provides distributed data access paths to objects built from local (LSOM) components. The DOM is responsible for the creation of reliable, fault-tolerant VM storage objects from local components across multiple ESXi hosts in the vSAN cluster. It does this by implementing distributed RAID types for objects.
Each object in a vSAN cluster has a DOM owner and a DOM client.
DOM owner exists per object and it determines which processes are allowed to send I/O to the object.
DOM client performs the I/O to an object on behalf of a particular virtual machine and runs on every node that contains components.
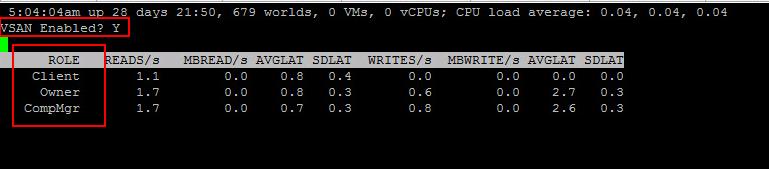
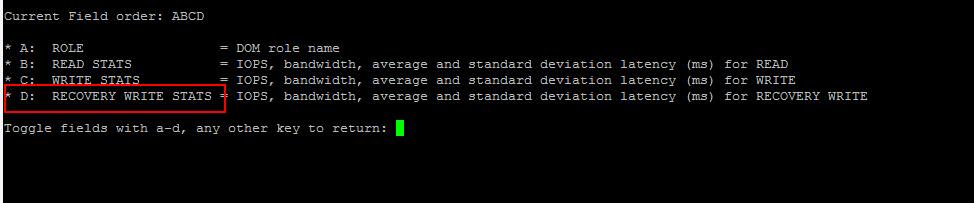
In ESXTOP vSAN view, It displays default view such as DOM role name, Read Stats and Write Stats includes IOPS, bandwidth, average and standard deviation latency (ms) for read and write.
There is one more additional field is Recovery write stats. You can press “f” and Type “d” to add Recovery write stats in VSAN view of esxtop.This is the “recovery write statistics” and displays how much writing on behalf of a remediation task that is doing a rebuild of components in the Virtual SAN cluster.
Additional Performance metrics to monitor VM disks, physical disk and disk adapter
In addition to the vSAN metrics in esxtop, you can monitor few other metrics to monitor the virtual disk performance, the disk adapter (vmhba) and physical disk device performance.
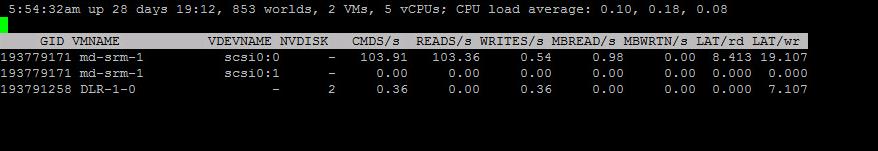
Press “v” to switch VM disk performance. You can press “e” and enter GID of the VM to display the stats for each of the vmdk of the virtual machine.
In the below example, I pressed “e” and typed the GID of the vm “md-srm-1”. It displays the performance stats of both the vmdk’s scsi0:0 & scsi0:1.
Press “d” to switch to disk adapter view to analyse the performance of the disk adapter of the vSAN disks.
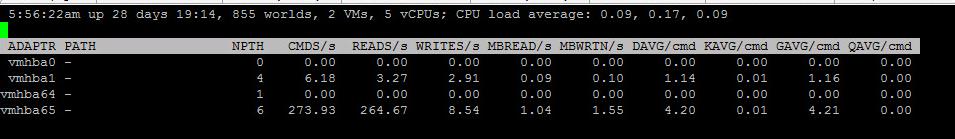
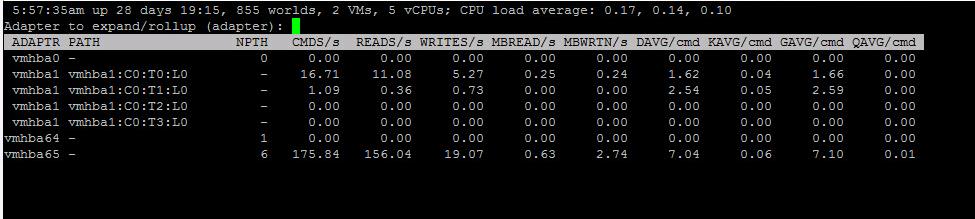
Press “e” and type the adapter name to expand the adapter to see each of the disks attached to the disk adapter.
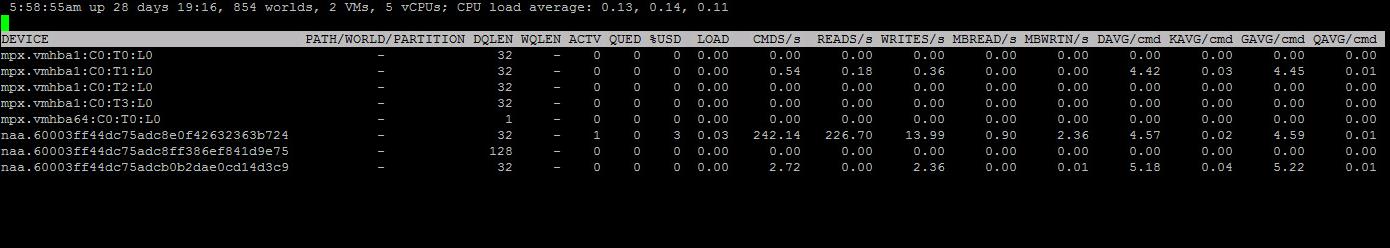
Press “u” to switch to disk device performance stats of the vSAN disks.
That’s it for now. I hope this article will help you to understand how to monitor vSAN performance using esxtop. Thanks for reading!!!. Be social and share it on social media, if you feel worth sharing it.
How to Use vSAN Observer to view vSAN Cluster Performance Statistics